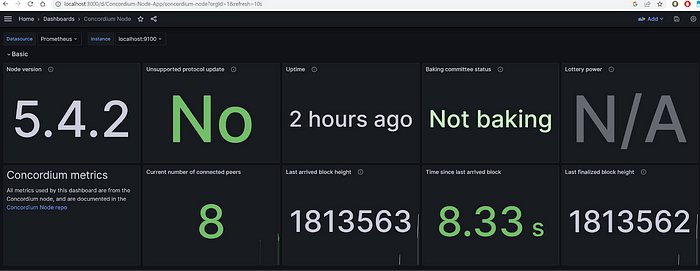
Concordium node runners can configure their node to get insight into resource usage, node and baker activity and health, and get notified about upcoming protocol updates. This helps when planning updates, hardware improvements, and with baker management.
The node monitoring is done using Prometheus and Concordium provides a Grafana dashboard you can import that shows relevant data, but you can customize this however you wish. To do this, all you need to do is set up Prometheus and Grafana. In this article we describe how to do that for a node running on a Windows machine, but you can use these components to monitor a node on any type of operating system.
Prometheus is an open-source monitoring and alerting toolkit designed for monitoring and collecting metrics from various targets in a distributed system. Prometheus follows a pull-based model, where it periodically scrapes metrics data from configured targets such as applications, services, or infrastructure components.
Grafana is an open-source data visualization and monitoring tool that is commonly used in conjunction with time series databases like Prometheus. It allows users to query, visualize, and understand their data through interactive and customizable dashboards. Grafana supports a wide range of data sources, including databases, cloud services, and monitoring systems.
The basic steps to set up node monitoring with these tools are:
1. Enable the Prometheus interface on the node.
2. Set up a Prometheus server.
3. Set up Grafana dashboard.
These steps are described in more detail below.
This article presumes you are already running a Concordium node. For instructions on how to set one up, please refer to the developer documentation and choose the node type you’d like to run.
Enable Prometheus on the node
First, you need to enable the Prometheus interface on the node. The specifics of how you do this depend on the operating system you are running. In the case of a Windows node, add the line below to the mainnet and/or testnet section of the nodes.toml config file which is usually located in \ProgramData\Concordium\Node Runner by default.
node.env.CONCORDIUM_NODE_PROMETHEUS_LISTEN_PORT=’9100'
After that, save the config file and restart your node.
There are other parameters that can be configured for the Prometheus configuration. If you want to learn more about the possible monitoring configurations or what the metrics represent for the Concordium node, you can read more here.
Set up a Prometheus server
Download the Prometheus package for your operating system.
Modify prometheus.yml so that there is a new job with node as the target:
- job_name: ‘concordium-node’
# Override the global default and scrape targets from this job every 15 seconds.
scrape_interval: 15s
static_configs:
- targets: [‘localhost:9100’]
Note that the port number after localhost (9100 in this example) must match what you have configured on your node in the section above.
Start the Prometheus service by running prometheus.exe.
Set up a Grafana dashboard
Now we need to visualize the Prometheus metrics. Luckily, Concordium provides a Grafana dashboard to get you started, so that’s what we will use here. Download and install Grafana for your platform.
Once installed, open Grafana with http://localhost:3000/ from your browser. The initial username and password should both be admin.
Navigate to Administration and click Data sources.
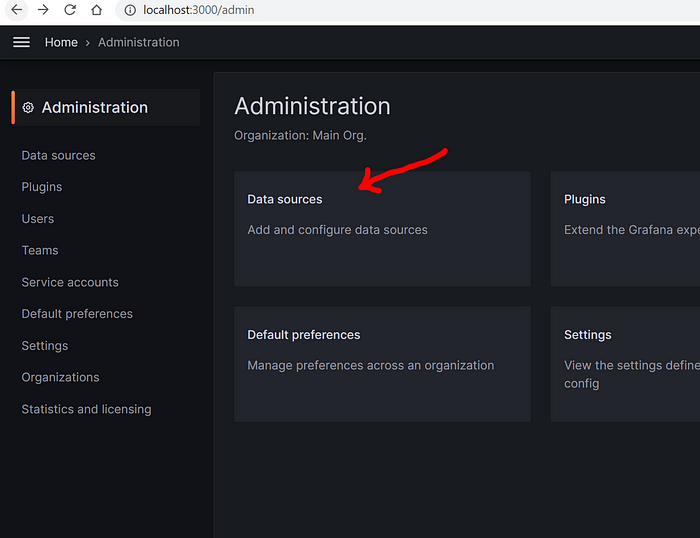
Click Add data source and select Prometheus.

Update the Prometheus server URL to reflect your local host with port 9090.
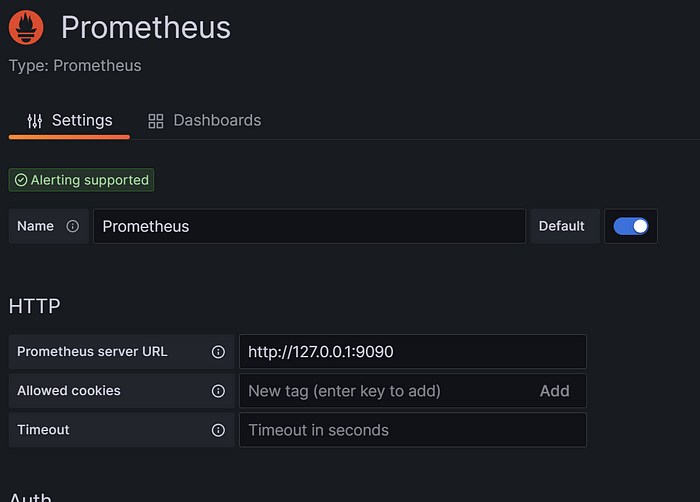
Now you need to import the Concordium dashboard into Grafana. Go to Dashboards and click Import.
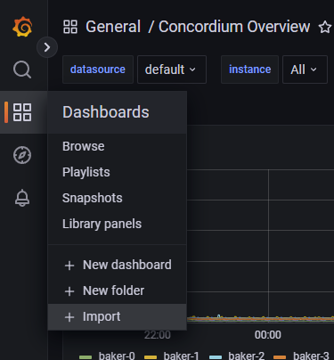
Enter 18983 as the ID. Or you can go to the Grafana marketplace and download the dashboard.

Now your Grafana dashboard is set up and you are all set to monitor your Concordium node!
